The first article in a four-part series on platform modernization. Most modernization efforts fail in the boardroom before they fail in production. Reframing reliability as a financial recovery story is how you get them funded.
Most modernization pitches to the board start with technology. The stack is outdated. Recruiting is harder. The architecture limits what product can ship.
All true. None of it lands.
What lands is the financial story. The cost of unreliability is already being paid. It just isn’t tracked as a line item.
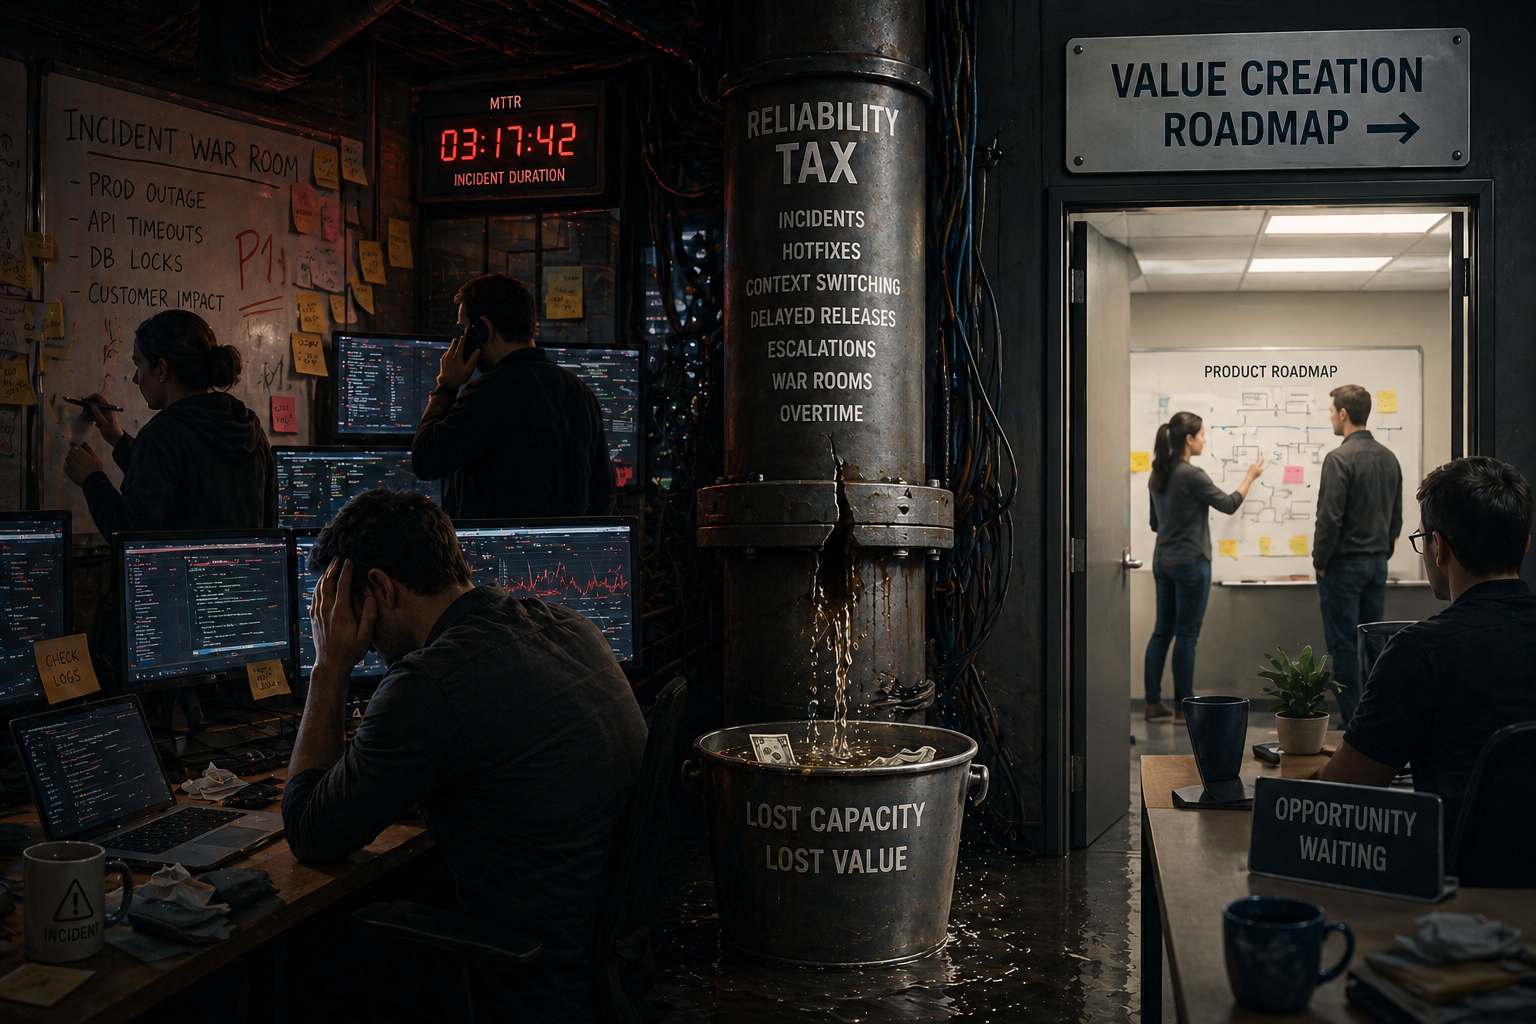
A portfolio company I worked with had engineering capacity drag of roughly 30% on unplanned work. Production incidents, hotfixes, customer escalations, war rooms. On a 20-person engineering org with a fully loaded cost of around $5M, that’s $1.5M annually flowing to firefighting instead of roadmap delivery.
Run the math the way a CFO would. That $1.5M of capacity should be building the capabilities driving ARR expansion. Instead it’s preserving the status quo. Compound it over a 5-year hold period and you’re talking about $7-8M in capacity that never reached the value creation plan.
That’s the framing PE boards understand. Reliability isn’t a technical concern. It’s a margin and velocity problem hiding in the engineering org chart.
The Reliability Tax
Every legacy platform charges a reliability tax. It’s the recurring cost a company pays when complexity consumes engineering capacity, slows roadmap delivery, and increases operational risk.
The tax shows up as incident response hours, hotfix cycles, war rooms, delayed launches, and customer escalations. It compounds quarter over quarter as the architecture gets more tangled. Eventually you’re running to stand still while the value creation plan slips.
Most CTOs intuitively know the reliability tax exists. Few have made it visible to the board. That’s the work.
Why the Reliability Tax Hits Harder in PE-Backed Environments
PE-backed CTOs operate under constraints that make the reliability tax especially expensive.
Fixed exit timelines. The hold period is typically 4-7 years. Modernization that drags into year four becomes a diligence liability, not a value driver. Buyers discount unreliable platforms during tech diligence. The ones who don’t… walk away.
Margin pressure. Financial sponsors target specific EBITDA expansion. Engineering capacity consumed by unplanned work is non-productive labor, and non-productive labor compresses margin. PE-backed companies can’t afford to run two platforms indefinitely or staff a bloated incident response function.
Board reporting cadence. Quarterly board meetings scrutinize the business metrics, not the engineering ones. Engineering cost as % of revenue. Feature delivery against committed roadmap. Customer escalations threatening the renewal base. When engineering grows but roadmap velocity stays flat, the financial sponsor notices. When product launches slip because “the platform wasn’t ready,” the question becomes whether technology is a bottleneck or an enabler.
Value creation plan dependencies. The PE thesis usually depends on specific product or market expansion that requires engineering throughput. If the platform can’t support the planned enterprise tier, the multi-product cross-sell motion, or the geographic expansion, the value creation plan slips. That’s how a tech debt problem becomes a fund-level return problem.
The reliability tax is the mechanism by which platform complexity converts into missed value creation. Naming it that way builds the bridge from engineering reality to board-level concern.
Making the Reliability Tax Visible
Reliability improvements are invisible until the CTO converts them into capacity, margin, and execution metrics. That conversion is the central job.
You need two sets of metrics. One for engineering to track modernization progress. One for the board to understand business impact. Conflating them is how modernization initiatives lose support.
Engineering metrics (internal use). These tell the team whether modernization work is actually reducing complexity and risk. The DORA metrics are the standard:
- Deployment frequency
- Change failure rate
- Mean time to recovery (MTTR)
- Lead time for changes
Track these on engineering dashboards. Use them to validate that modernization is working. Don’t put them in board decks.
Business metrics (board reporting). These translate engineering improvements into outcomes the financial sponsor and board actually evaluate:
- Engineering capacity allocation. What percentage of capacity is going to roadmap delivery vs. unplanned work? Boards understand this as productivity. Moving from 60/40 to 80/20 is a margin lever.
- Feature delivery against committed roadmap. On-time delivery rate for committed product capabilities. Maps directly to value creation plan execution.
- Revenue per engineer. ARR divided by engineering headcount. Improving this without growing headcount is direct margin expansion.
- Customer-impacting incidents. Frequency and severity of incidents that hit customers. Maps to NPS, churn risk, and renewal base health.
- Engineering cost as % of revenue. Track this over multiple quarters. Modernization should bend this curve favorably as revenue scales faster than headcount.
The work of the CTO is connecting the first list to the second. When MTTR drops from 4 hours to 30 minutes, that’s not a board update. When that improvement reallocates 15% of engineering capacity to roadmap work, accelerating the enterprise tier launch by a quarter and adding meaningful ARR… that’s a board update.
Track both. Report only the second.
The Board Conversation
PE boards care about three things: EBITDA expansion, valuation multiples, and exit readiness. The reliability tax pitch needs to speak that language.
Don’t lead with technology problems. Lead with the operational drag on margin.
“Engineering is currently allocating 30% of capacity to unplanned work. On our cost base, that’s roughly $1.5M of capacity not flowing to the roadmap. If we drive that down to 10-15% over 18 months, we’re freeing up the equivalent of 3-4 senior engineers worth of capacity without growing headcount. That capacity gets redeployed to the value creation initiatives we’ve already committed to.”
Now connect it to the value creation plan:
“Specifically, this unlocks acceleration on [the strategic initiative the board already cares about]. Whether that’s the AI features product has committed to, the enterprise tier in the operating plan, or the integration capabilities that enable the cross-sell motion. The capacity has to come from somewhere. Either we hire into a higher cost base, or we recover what’s currently being lost to operational drag.”
Then address exit positioning:
“Platform stability is a line item in tech diligence. The trend we want is engineering cost as % of revenue declining, customer-impacting incidents declining, and roadmap delivery against commitments improving. That trend story tells buyers the platform is a value driver, not a hidden liability. The opposite trend creates a discount we don’t want to argue against in 24 months.”
The frame shifts from “we need better technology” to “we’re paying a reliability tax that’s compressing margin and creating exit risk.”
Boards fund the second conversation. They defer the first one.
The pattern: don’t ask the board to care about engineering metrics. Translate them into the business metrics they already track. The board doesn’t need to understand MTTR. They need to understand that engineering capacity is being lost to operational drag, and modernization recovers that capacity to redeploy against the value creation plan.
Reliability Is Deliberate Simplification
Modernization done well produces a more reliable system. But reliability isn’t a side effect of choosing the right architecture. It’s the result of deliberate simplification. Reducing coupling, clarifying boundaries, making dependencies explicit.
Microservices aren’t inherently more reliable. They introduce new failure modes: network partitions, distributed state, cascading failures. The reliability benefit comes from the process of decomposition, not the target state. Each component ends up with a smaller surface area, fewer responsibilities, clearer failure modes.
The goal is operational clarity. A state where the team can answer quickly: What changed? What broke? How do we fix it? And where engineering capacity flows to the roadmap instead of disappearing into firefighting.
When modernization is framed as recovering the reliability tax… visible, measurable, connected to the value creation plan… the justification writes itself. The cost is already being paid. It just needs to be made visible in the language the board already speaks.
The next article in this series covers how to actually do the work. Sequencing the migrations. Choosing between extraction and encapsulation. Maintaining delivery momentum without destabilizing production.